 KDE API Documentation - Graph Legend (GCompris-qt)
GCompris-qt
Graph Legend
This page explains how to interpret the graphs that are generated by doxygen.
Consider the following example:
This will result in the following graph:
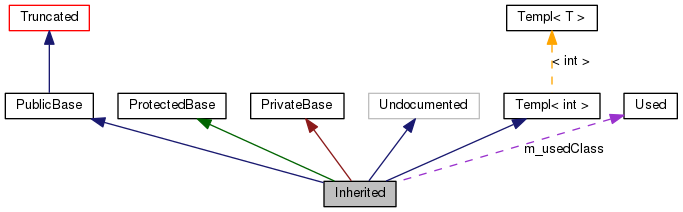
The boxes in the above graph have the following meaning:
- A filled gray box represents the struct or class for which the graph is generated.
- A box with a black border denotes a documented struct or class.
- A box with a grey border denotes an undocumented struct or class.
- A box with a red border denotes a documented struct or class forwhich not all inheritance/containment relations are shown. A graph is truncated if it does not fit within the specified boundaries.
The arrows have the following meaning:
- A dark blue arrow is used to visualize a public inheritance relation between two classes.
- A dark green arrow is used for protected inheritance.
- A dark red arrow is used for private inheritance.
- A purple dashed arrow is used if a class is contained or used by another class. The arrow is labeled with the variable(s) through which the pointed class or struct is accessible.
- A yellow dashed arrow denotes a relation between a template instance and the template class it was instantiated from. The arrow is labeled with the template parameters of the instance.
This file is part of the KDE documentation.
Documentation copyright © 1996-2015 The KDE developers.
Generated on Tue Jun 2 2015 21:47:48 by doxygen 1.8.9.1 written by Dimitri van Heesch, © 1997-2006
Documentation copyright © 1996-2015 The KDE developers.
Generated on Tue Jun 2 2015 21:47:48 by doxygen 1.8.9.1 written by Dimitri van Heesch, © 1997-2006
KDE's Doxygen guidelines are available online.